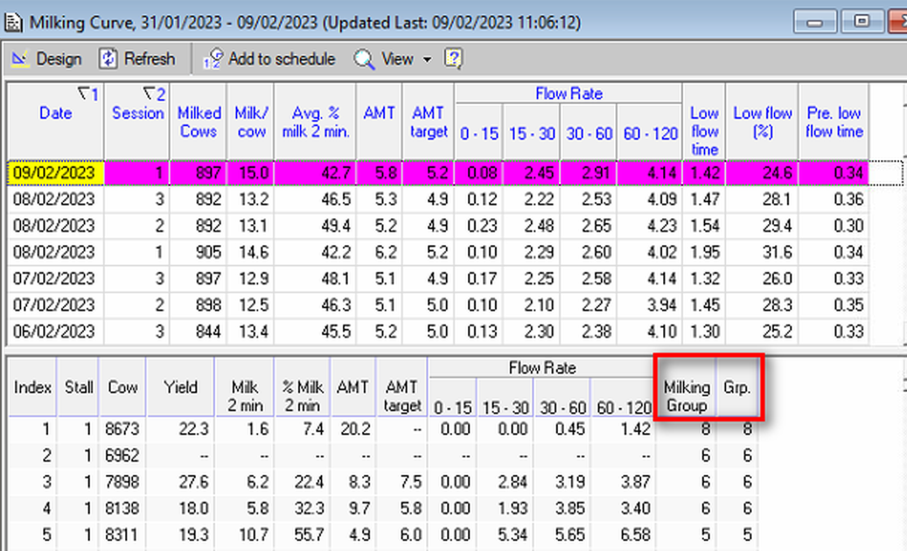
Milking Curve Report Parameters
The Milking Curve detailed report and graph parameters can be adjusted to display various time periods, or report design.
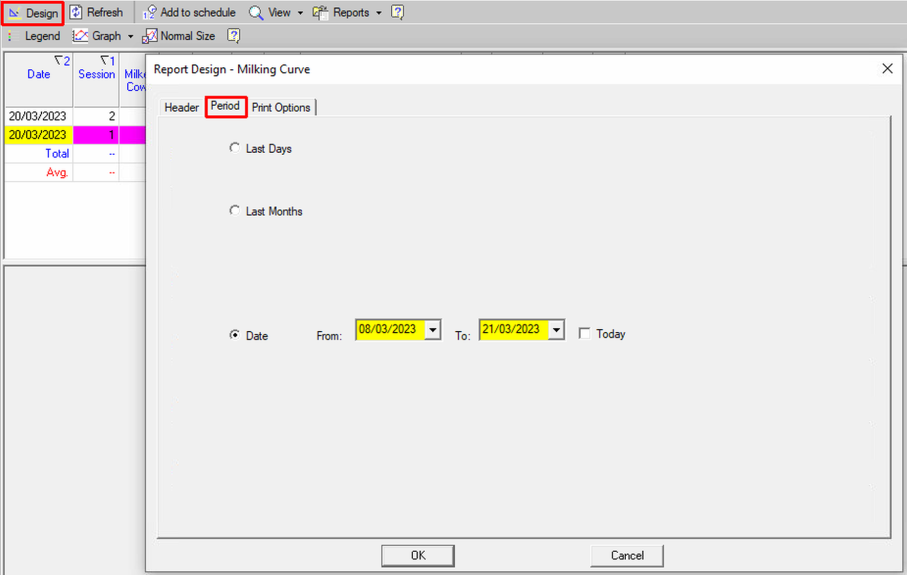
Adjust Milking Curve Time Periods
Changes the time period for the results you want displayed. Use this option to compare and evaluate the results over time, or after changes were introduced.
To Adjust the milking curve periods
-
Open the Design window.
-
Select the Period tab.
-
Select one of the following period options, and set the parameter.
-
Last Days - set the number of days data you want displayed,
-
Last months - set the number of months data you want displayed,
-
Date - set the specific time frame of data you want displayed.
-
Click OK to save your changes.
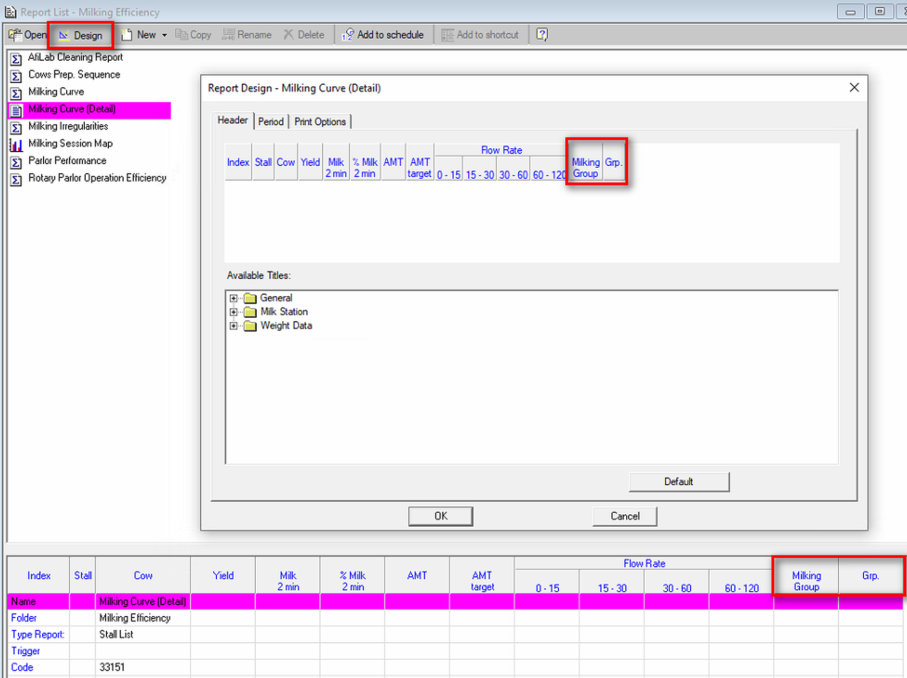
Adjust Milking Curve Detailed Report Design
You can adjust the detailed report by adding system headers for the milking curve graph.
To adjust the report headers
-
Open the Design window. Make sure the Header tab is selected.
-
In the Available Titles pane, open the folders and double-click the titles to add them to the report.
-
Click OK to save your changes.
These changes are displayed under the detailed report on the milking curve report.